
Hardware-in-the-Loop (HiL) VHDL Verification with Arty-Z7
In the previous post, we set up a Software-in-the-Loop (SiL) test environment using Python and GHDL. This method is quite useful for functional verification of algorithms, but it can't catch some issues that arise when running on real hardware: timing violations, state machine synchronization errors, clock domain crossings, real resource usage... It's possible to see some of these in simulation, but testing on hardware after implementation is the most reliable way to cover all of them. Also, simulations can take hours with long test vectors on complex designs.
In this post, we'll take the same FIR filter example a bit further by running it on hardware on the Arty Z7 and controlling its outputs from a Python GUI while visualizing the results in real-time. For products that will use a Zynq chip like the one on the Arty board, this is a good example of simple Hardware-in-the-Loop (HiL) testing.
Method
We're expanding the same 19-tap FIR filter from the SiL example (let's add infrastructure to configure the filter taps externally too), but this time we're running it on the PL (FPGA fabric) side of the Arty Z7. The PS (ARM) side of the Zynq will serve as a UART protocol handler, while the PL side implements the state machine that runs the FIR and tests the FIR itself. To handle communication between PS and PL, we'll simply use AXI GPIO, and instead of setting up synchronization via interrupts, we just use very simple handshakes between PS and PL for this simple test setup. You can find the complete project source in the sobulabs/vhdl-artyz7-hil-fir repo.
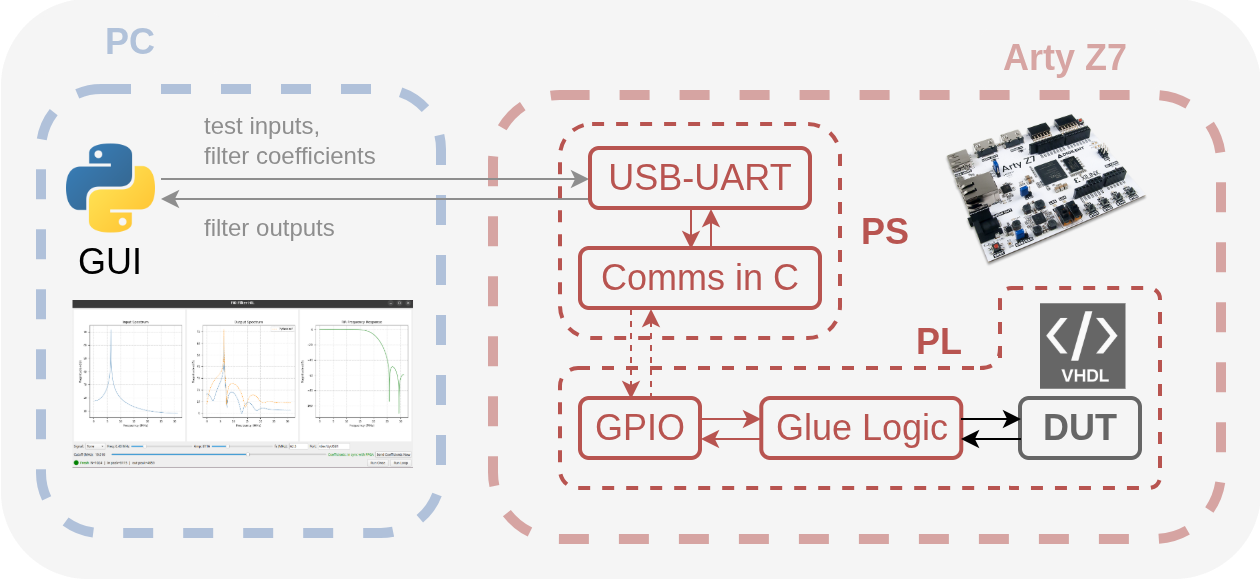
The architecture consists of three parts:
- Python GUI (PC): Generates test signals (chirp, tone, noise...), sends them to the FPGA over UART, receives the output, applies FFT, and visualizes the resulting spectra
- PS side (ARM): Bare-metal C code, receives messages from UART, forwards them to PL via GPIO, collects results
- PL side (FPGA fabric): FIR filter (DUT) + state machine (
fir_emulation_interface.vhdl), takes samples into buffers, feeds them to the FIR at full clock rate (PS clock)
PL: Emulation Interface
We use a simple state machine that works with GPIO handshake between PS and PL:
entity fir_emulation_interface is
    Generic (BUFFER_DEPTH : integer := 1024);
    Port (
        clk        : in  STD_LOGIC;
        data_in    : in  STD_LOGIC_VECTOR(15 downto 0);
        ctrl_in    : in  STD_LOGIC_VECTOR(2 downto 0);    -- [wr_en, rd_en, ack]
        data_out   : out STD_LOGIC_VECTOR(15 downto 0);
        status_out : out STD_LOGIC_VECTOR(1 downto 0);    -- [done, busy]
        coeff_gpio : in  STD_LOGIC_VECTOR(31 downto 0);
        coeff_we   : in  STD_LOGIC
    );
end fir_emulation_interface;
The state machine works as follows: IDLE → FILLING (PS writes 1024 samples to buffer) → RUNNING (PL feeds all samples to FIR at full speed) → READY (PS reads output) → IDLE.
The key point of this approach is taking samples from PS in blocks, then processing them uninterrupted at PL's own clock rate. This way the FIR filter can work with deterministic data flow like in a real application - PS's slow AXI transactions don't affect the FIR's timing.
PS: Protocol Handler
The C code running on the PS side implements a simple buffered protocol (you can find the full source in the repo):
while (1) {
    sendStringUart("READY\r\n");
    u8 cmd; XUartPs_Recv(&Uart_Ps, &cmd, 1);
    if (cmd == 'C') loadCoefficients(...);

    // Receive 1024 samples from UART, write to PL buffer via GPIO
    for (i = 0; i < 1024; i++) {
        sample = readSample();
        XGpio_DiscreteWrite(&GpioDataIn, 1, sample);
        XGpio_DiscreteWrite(&GpioCtrl, 1, CTRL_WR_EN);  // pulse
        XGpio_DiscreteWrite(&GpioCtrl, 1, 0);
    }

    while ((XGpio_DiscreteRead(&GpioStatus, 1) & STATUS_DONE) == 0) { }

    // Read output, send to UART
    for (i = 0; i < 1024; i++) {
        out = XGpio_DiscreteRead(&GpioDataOut, 1);
        sendOutput(out);
        XGpio_DiscreteWrite(&GpioCtrl, 1, CTRL_RD_EN);
        XGpio_DiscreteWrite(&GpioCtrl, 1, 0);
    }

    XGpio_DiscreteWrite(&GpioCtrl, 1, CTRL_ACK);
}
Python GUI
The GUI written with PyQt5 communicates with the board (i.e., via the PS source mentioned above) over UART:
def run_fir_sequence(port_name, samples_int16, new_coeffs_int16=None):
    with serial.Serial(port_name, 921600, timeout=10) as ser:
        wait_for_ready(ser)

        if new_coeffs_int16 is not None:
            ser.write(b'C')
            ser.write(np.array(new_coeffs_int16, dtype='>i2').tobytes())
        else:
            ser.write(b'S')

        ser.write(samples_int16.astype('>i2').tobytes())
        rx = ser.read(1024 * 2)

    return np.frombuffer(rx, dtype='>i2').astype(np.int16)
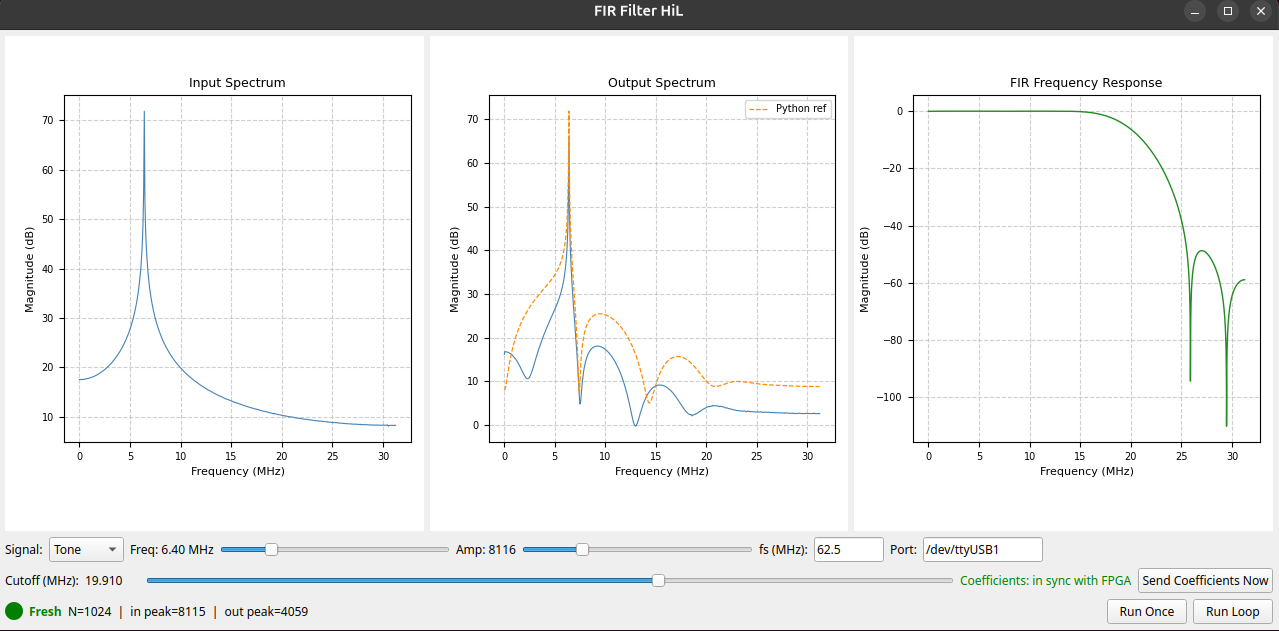
From the GUI we can adjust signal type (tone, chirp, noise, impulse), frequency, amplitude, and FIR cutoff frequency with sliders. When the cutoff is changed, the Python GUI backend calculates new coefficients (scipy.signal.firwin) and sends them to the FPGA in the next test. Both the FPGA result and Python reference are shown in the output spectrum - we can see the fixed-point error instantly.
Automation
This Arty-based HiL project is actually very similar to a real Zynq-based product development process, and in such projects it's very important that everything can be done through scripts for repeatability and traceability. To support this and provide a template for such Zynq projects, we've fully scripted the project's Vivado and Vitis flows.
The design_1.tcl file packages the FIR as an IP, creates the Vivado project, connects PS7 + AXI GPIO + PL modules, and runs bitstream generation commands. vitis_buildws_loadprog.py compiles the bare-metal application and loads it to the board (there's also a separate script that just loads an already-built program to the board). This way we can version everything and develop without needing to manually click things in the GUI.
HiL Capabilities
Let's take a look at what we gain by moving to HiL like in this project:
-
Speed: Processing 1024 samples can take ~2-3 seconds in simulation, but ~16 microseconds on hardware (the FIR itself). By shortening the sleep durations in the PS code, even with inevitable UART latencies the loop can be around ~50 ms, making it 50x faster.
-
Catching timing issues: Timing isn't guaranteed in simulation, but on hardware if there's negative slack the output comes out corrupt. We can check timing in the implementation report even before testing.
-
State machine errors: Issues like double-stepping can slip through in event-based simulation and reveal themselves on real hardware.
-
Resource usage: We can analyze LUT, DSP, BRAM reports after implementation. Since the DUT is fully connected to this UART emulator at its periphery, Vivado is also prevented from removing (optimizing-out) resources.
-
Interactive testing: We can change parameters from the GUI and see results instantly - useful for algorithm optimization.
Just a note: We're not really comparing SiL with HiL here, that doesn't really make sense of course. Both stages should exist in any project with incremental development.
Discussion / Conclusion
The HiL environment introduced in this post is one step beyond SiL: we're running the VHDL algorithm on real hardware, but test control and visualization still remain in Python. We can provide buffered data flow with DUT + a simple state machine on the Zynq's PL side, run a UART protocol handler on the PS side, and control the entire test process from a Python GUI. This way we can catch timing violations, state machine synchronization errors, and critical path issues that we wouldn't see in simulation. And there's speed of course - we can test 50x faster than simulation (when sleeps are adjusted accordingly), change parameters from the GUI and see results instantly.
Just like with SiL, this approach doesn't aim to replace professional verification methodologies and isn't suitable for most large-scale projects. But it works quite well when we want to catch post-implementation timing issues, quickly try prototypes, or check fixed-point precision in real-time. The Vivado and Vitis automated workflows (we define the entire system with just TCL and Python files) are also useful for convenience for version control and repeatability, serving as a template for other similar projects.
You can find all source code in the sobulabs/vhdl-artyz7-hil-fir repo.
Hoping it's useful.